Should I Use Lift or Optimization?
Lift vs. Optimization
Brand lift and optimization metrics are different metrics that answer different questions:
Brand Lift Statistical Significance
Answers question: Is a campaign or a campaign tactic driving lift at all? Use when evaluating results at a couple fixed points (e.g. mid and post-campaign reads) for reporting.
Optimization
Answers question: Is a tactic pulling overall campaign performance up or down? Use when making optimization decisions to reallocate budget or traffic between tactics throughout a campaign.
Why does this matter? Why shouldn't I use brand lift statistical significance for optimization decisions?
Brand lift is meant to be evaluated few times
Statistical significance is based on a statistic - p values - that are meant to be looked at and evaluated once - at the end of a study. When statistical significance is evaluated repeatedly, the chances that at least one of the statistical significance determinations will be a false positive or a false negative increases quickly. While the increase in these error rates is modest when evaluating 2 or 3 times whether a tactic is statistically significant, the increase in these error rates is dramatic when evaluating a tactic weekly, for example.
Brand lift does not compare tactics
Statistical significance does not compare the performance of two tactics - it compares the performance of those exposed to a single tactic to those not exposed at all, to know if the tactic is driving lift. So, a tactic may drive lift at a statistically significant level, but that does not mean the difference in lift between two tactics is statistically significant.
Any tactic is statistically significant with enough sample
Because it is rare to have a tactic that drives literally 0.0% lift, a tactic with negligible observed lift (e.g. 0.2%) can be statistically significant with a large enough sample. That is because statistical significance reports the confidence that there was any lift at all, so with enough sample, even negligible lifts are statistically significant.
Example
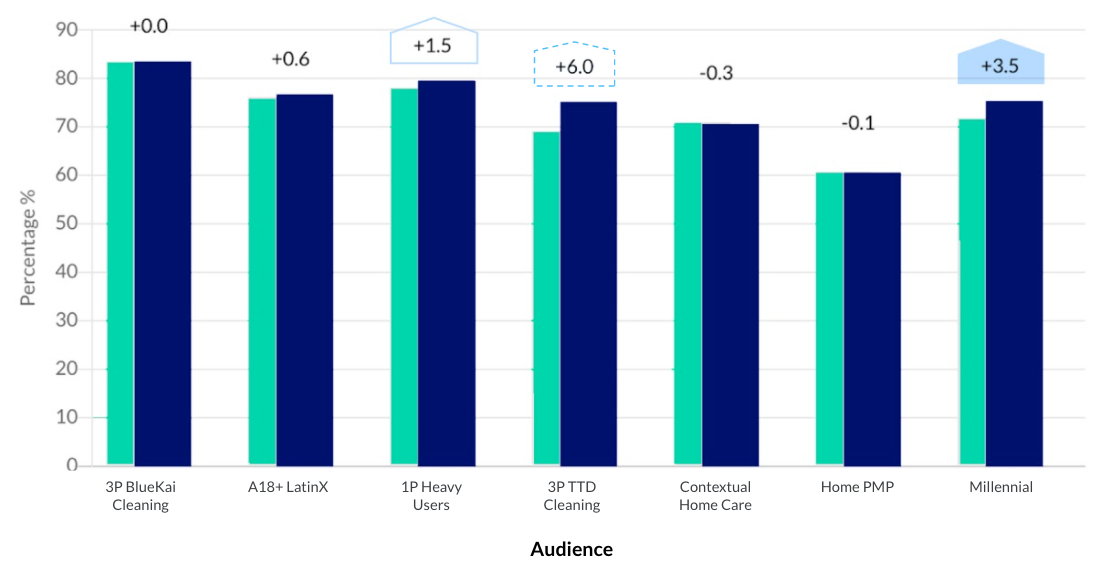
The campaign below is showing a 3P TTD Cleaning target with 6.0% lift and statistical significance at a low, 80% threshold. The 1P Heavy Users target has only 1.5% lift, but is statistically significant at a higher, 90% threshold. And then there is the Millennial target that has lift between the other two targets, but is statistically significant at a higher, 95% threshold.
What can you optimize with this intelligence? The traditional answer is to wait for more data. But you already have a lot of data. What is missing is a metric that answers an optimization question, not a post-campaign question.
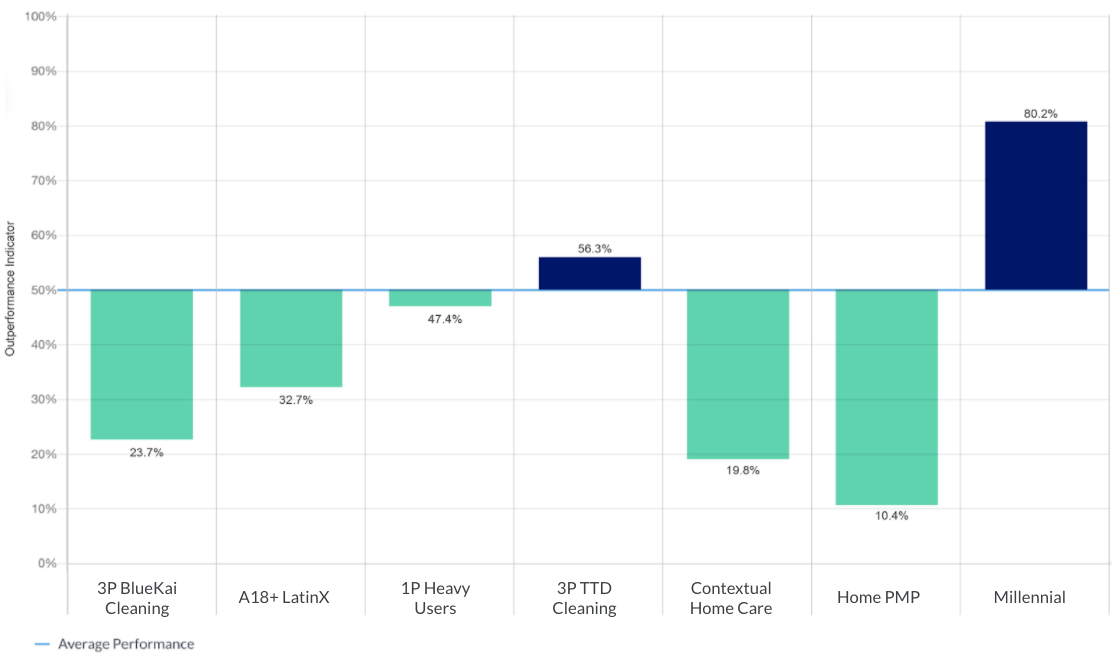
Outperformance Indicators combine observed lift and confidence levels into a single, sortable metric that answers the optimization question: How much confidence can I have that a tactic is helping the campaign, that is, pulling up the campaign average?
When applied to this campaign, we see that we can be 80.2% confident that Millennial is helping the campaign, 56.3% confident that 3P TTD Cleaning is helping the campaign and 47.4% confident that 1P Heavy Users is helping the campaign.